TEMPERATURE SWEEP
Determine stability, melting point and phase transitions
Model effect of heating/cooling ramps & cycling in rotational or oscillatory mode.
Temperature sweep efficiently probes rheological changes with much flexibility, such as softening, melting and curing across a temperature range or over multiple heat-cool cycles using the desired ramp rate to model the process and application.
-Does your product reversibly or irreversibly change after storage in a hot or cold car?
-Is your product sensitive to temperature changes during manufacturing that impact product efficacy and quality?
This assay can be performed in the rotational mode with either a constant shear rate (1/sec) or shear stress (Pa) or in the oscillatory mode with a constant frequency along with either a constant strain or stress that should be well within the LVER determined with an amplitude sweep.
Figure 1 demonstrates how temperature sweep quantifies the difference in spreadability of 2 butter products under constant frequency. The less stiff, more spreadable butter (red line) has a lower G* (complex modulus = stiffness) between refrigerator and room temperatures.
Figure 2 shows an application, also under constant frequency using multiple heating and cooling cycles resulting in an irreversible rheological change. A more rheologically stable form of the material was generated and confirmed with subsequent heating and cooling cycles.

Figure 3 compares generic (blue curves) and Reference Listed Drug (RLD; red curves) creams with a multiple 5 to 50C temperature cycling assay performed with a single frequency (1Hz) under 1% strain (previously determined with an amplitude sweep). This assay modeled the potential impact of processing temperatures that may induce rheological changes. Duplicate assays show small, yet consistent differences between to 2 samples.

Figure 4 shows melting point determination for a food product using a temperature ramp (20 to 90C at 2C/min) performed with single frequency (1Hz) under 0.1% strain. Melting points (52.7 and 52.8°C; n=2) were defined when phase angle (green curve) is 45°C and G'=G" (G’G"-crossover).
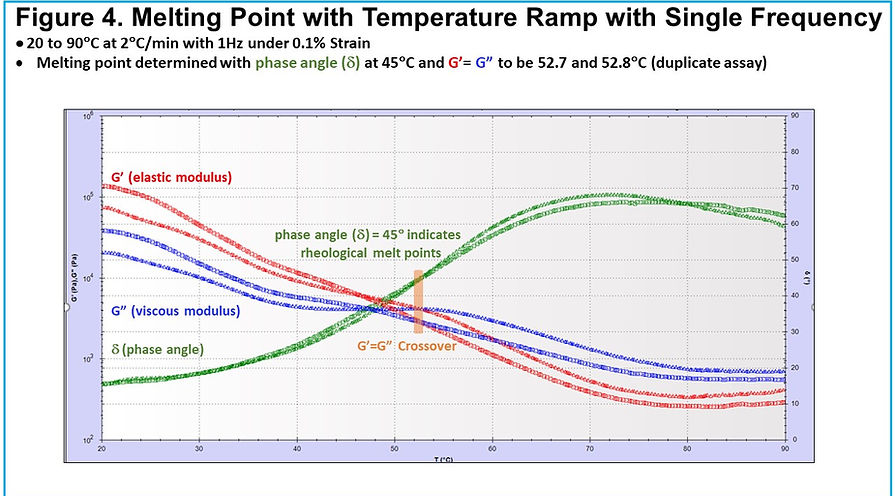
Figure 5 shows viscosity changes (blue curve) during temperature cycling (red curve) for a food product using a single low shear rate (rotational mode) to investigate the irreversible effect of temperature cycling to model a manufacturing process.
